CLASS DIAGRAM:-
Classes and interfaces:- In UML show architecture and features of the designed system.
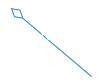
Aggregation:- is a special type of association in which objects are assembled or configured together to create a more complex object. An aggregation describes a group of objects and how you interact with them.
Dependency :-relationship is a relationship in which one element, the client, uses or depends on another element, the supplier.
Composition :-represents whole-part relationships and is a form of aggregation.
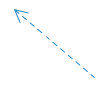
Generalization: is a relationship in which one model element (the child) is based on another model element (the parent).
Association is a relationship between two classifiers, such as classes or use cases, that describes the reasons for the relationship and the rules that govern the relationship.
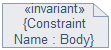
Constraint is an extension mechanism that enables you to refine the semantics of a UML model element.
Note :contains comments or textual information.
Diagram:-
DATA FLOW DIAGRAM:-
It’s easy to understand the flow of data through systems with the right data flow diagram software. This guide provides everything you need to know about data flow diagrams, including definitions, history, and symbols and notations. You’ll learn the different levels of a DFD, the difference between a logical and a physical DFD and tips for making a DFD.
Process Notations:- A process transforms incoming data flow into outgoing data flow.

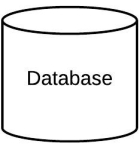
Datastore Notations. Datastores are repositories of data in the system. They are sometimes also referred to as files.

Dataflow Notations. Dataflows are pipelines through which packets of information flow. Label the arrows with the name of the data that moves through it.

External Entity Notations. External entities are objects outside the system, with which the system communicates. External entities are sources and destinations of the system’s inputs and outputs.

Diagram:-
LEVEL0-DFD

LEVEL1-DFD

LEVEL2-DFD

-
USECASE DIAGRAM:-
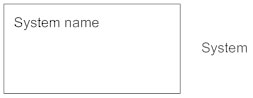
System:-
Draw your system’s boundaries using a rectangle that contains use cases. Place actors outside the system’s boundaries.
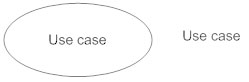
Use Case
Draw use cases using ovals. Label the ovals with verbs that represent the system’s functions.
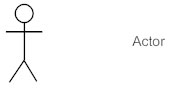
Actors
Actors are the users of a system. When one system is the actor of another system, label the actor system with the actor stereotype.
Relationships
Illustrate relationships between an actor and a use case with a simple line. For relationships among use cases, use arrows labeled either “uses” or “extends.” A “uses” relationship indicates that one use case is needed by another in order to perform a task. An “extends” relationship indicates alternative options under a certain use case.
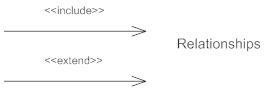
Diagram:-

-
SEQUENCE DIAGRAM:-
Lifeline Notation
A sequence diagram is made up of several of these lifeline notations that should be arranged horizontally across the top of the diagram. No two lifeline notations should overlap each other. They represent the different objects or parts that interact with each other in the system during the sequence.
A lifeline notation with an actor element symbol is used when the particular sequence diagram is owned by a use case.

A lifeline with an entity element represents system data. For an example, in a customer service application, the Customer entity would manage all data related to a customer.

A lifeline with a boundary element indicates a system boundary/ software element in a system; for example user interface screens, database gateways or menus that users interact with, are boundaries.

And a lifeline with a control element indicates a controlling entity or manager. It organizes and schedules the interactions between the boundaries and entities and serves as the mediator between them.
Diagram:-

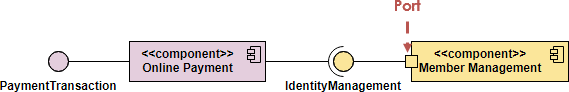
COMPONENT DIAGRAM:-
-
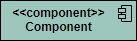
Component
A component is drawn as a rectangle with optional compartments stacked vertically. A component can be represented as just a rectangle with the component’s name and the component stereotype text and/or icon. The component stereotype’s text is “<<component>>” and the component stereotype icon is a rectangle with two smaller rectangles protruding on its left side.
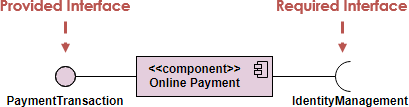
Component Interfaces
Provide Interface
Provided interfaces define “a set of public attributes and operations that must be provided by the classes that implement a given interface”.
Required Interface
Required interfaces define “a set of public attributes and operations that are required by the classes that depend upon a given interface”.
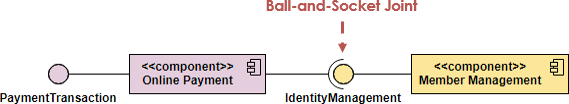
Component Assemblies
Components can be “wired” together using to form subsystems, with the use of a ball-and-socket joint.
Port
A port (definition) indicates that the component itself does not provide the required interfaces (e.g., required or provided). Instead, the component delegates the interface(s) to an internal class.